Tools for people who follow the watts
Everything on this site is free to read. These tools are for analysts, journalists, investors and builders who need to model, compare, present and track the numbers. Every tool uses the same sourced data and keeps every range.
Plain terms: after checkout you get unlisted links (not DRM; please don’t share them). Supporter is $9/month; cancel any time. No accounts, no trackers. The underlying Epoch AI data is CC BY 4.0: you pay for curation, tools and updates.
Compute Brief · $29 Speculation
Scenario modeler
Set your own chip deliveries, power caps, utilization and retirement; get your own 2026–2028 compute path with a low–high band, which constraint binds (chips or watts), and JSON/CSV/SVG/PNG export. Labeled speculation on screen and in every export.
Compute Brief · $29
Lab-vs-lab comparator
Pick two to four labs or parent companies; ranges animate side by side, a plain-language verdict says whether 90% intervals overlap, and the view exports to SVG/PNG/CSV/JSON with the citation baked in.
Compute Brief · $29
Chart & embed kit
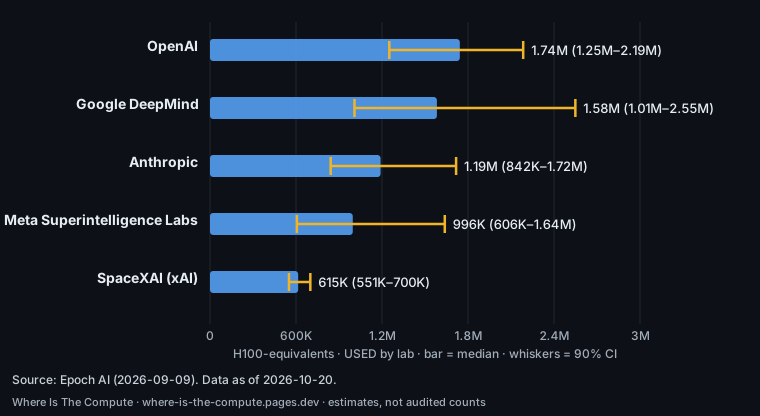
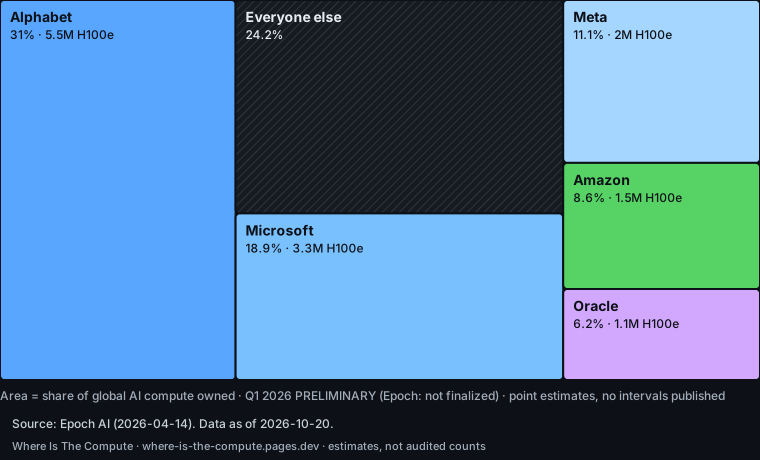
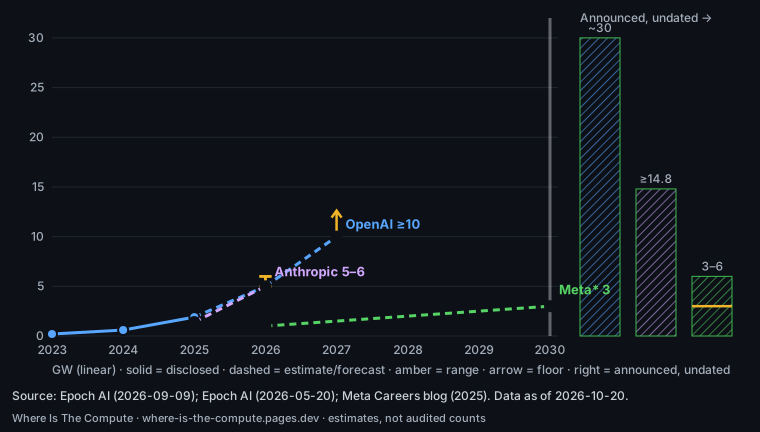
Every chart as a standalone SVG and a 2× PNG with its citation baked into the image, plus copy-paste iframe and <wic-chart> web-component snippets.
Compute Brief · $29
Slide-ready briefing deck
A 16:9 HTML deck (arrow-key navigation) plus a printable PDF, generated from the current data at build time: the answer, each view, ownership, clusters, gigawatts, caveats and sources.
- The answer
- Compute used
- Compute owned
- Who owns the world’s compute
- Cluster scale
- Gigawatts over time
- Announced vs installed
- Caveats
- Discrepancy log
- Sources
Supporter · $9/mo
Data feed + 'what moved and why'
Versioned JSON and CSV snapshots, a JSON Feed and RSS changelog of figure changes, each with a 'what moved and why' note tied to its source.
{
  "id": "2026-10-20-D4",
  "title": "OpenAI future capacity: what moved and why",
  "content_text": "Was: Roughly 30 GW by 2030 through Stargate. Why: Shown as '~30 GW total commitments (all partners)'; '2030' flagged as unverified timing."
}
Supporter · $9/mo
Provenance trail
Per-figure history: the value in Iggy's source doc, earlier source values (e.g. Epoch Q4 2025 vs preliminary Q1 2026), the current value, and the source, date and check date for each revision.
Show data table
| Stage | Value | Date | Source |
|---|---|---|---|
| Iggy’s source doc | ~1.74M (1.25M–2.19M) | 2026-10 | source doc |
| Verified | 1,743,000 (1,251,000–2,185,000) H100e | 2025-12-31 | Epoch AI |
Briefing call · $299
Custom scenario run
On the $299 call we run the scenario modeler on your assumptions together and you keep the JSON/CSV export plus follow-up notes with sources.
Bring a question; leave with an exported scenario and sourced notes.
Free, for everyone
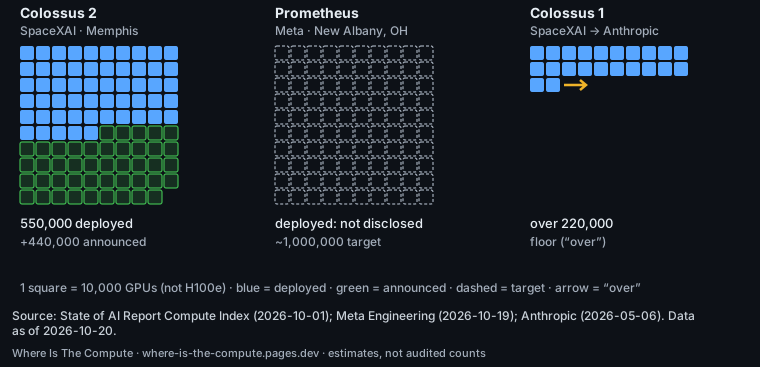
- Power & cluster atlas — Named sites (Colossus 1 & 2, Prometheus, Hyperion) as a filterable, sortable grid with MW/GW, chips, status, confidence and sources, plus an animated 1-square-=-10,000-GPUs scale comparison.
- Animated views: ownership treemap, GW race, cluster scale — Reusable SVG components (treemap, GW-over-time race with ranges, scale grid, range bars) shared by the explainer and the paid tools, each with a data-table equivalent and a reduced-motion static state.
- Share everywhere + per-page cards — X, LinkedIn, Reddit, Threads, Bluesky, Facebook, WhatsApp, Hacker News, Web Share and copy-link on every chart and figure, with prefilled text that cites the figure and source; per-page and per-chart OG/Twitter PNG cards rendered at build time.
- Decluttered home + clearer flow — One hero answer, one primary CTA ('Show me the gigawatts') into the interactive views, then key takeaways, then the paid upgrade; secondary content moved to /explore/, /atlas/, /tools/ and /caveats/.